Northeast Broward County Summary
Fort Lauderdale, Lauderdale-by-the-Sea, Pompano Beach, Lighthouse Point, Deerfield Beach and Wilton Manors
At the mid-year point, the single family ocean access market is showing more than simple stabilization. Across Northeast Broward County, the first half of 2026 points to a market that has regained momentum, with stronger sales activity, rising prices, and several key segments once again favoring sellers.

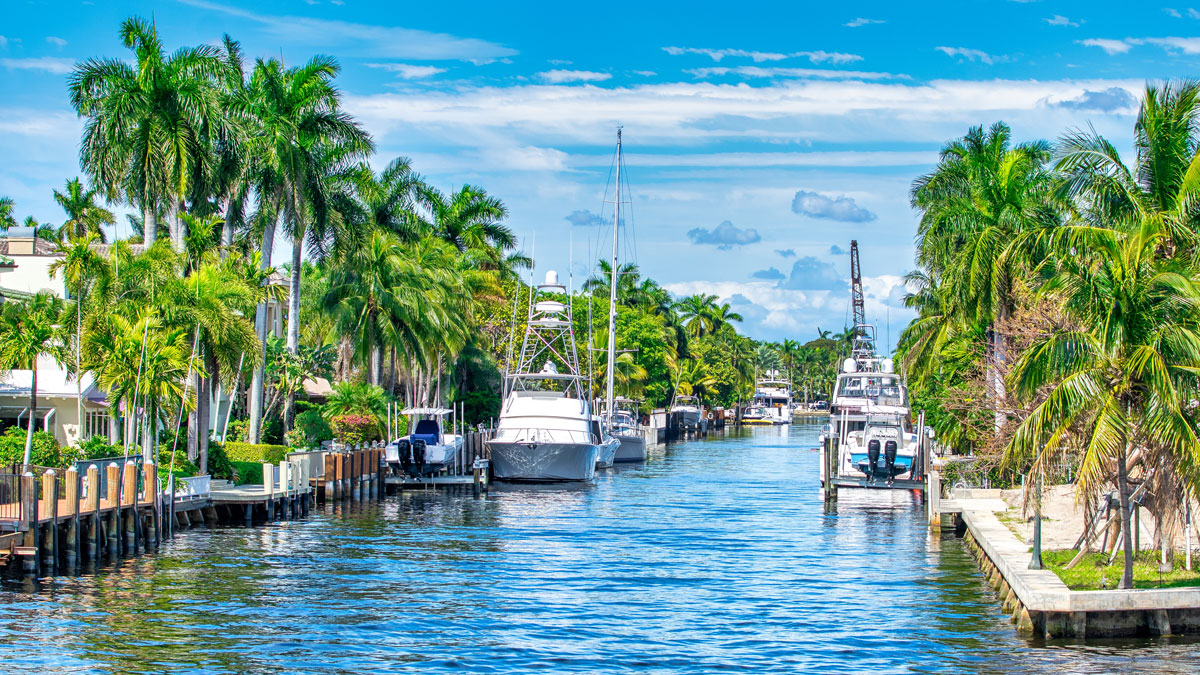
This shift is important because ocean access homes went through a period of adjustment after the pandemic-era surge. Inventory is no longer as tight as it was during the peak, but buyer demand has strengthened enough to absorb available supply more efficiently. For many buyers, the appeal remains clear: private dockage, access to the Intracoastal or Atlantic Ocean, and the ability to keep a boat behind the house remain difficult to duplicate.
The broader Northeast Broward Single Family Ocean Access market provides the clearest view of this mid-year improvement. Current conditions favor sellers, with 7.0 months of supply and a Waterfront Market Index of 74. Sales activity increased 18.0% year over year in the latest six-month period, while median sale price rose 9.6% to $2.0 million and median price per square foot increased 10.1% to $829. That combination of higher sales volume and stronger pricing suggests that demand is improving without relying only on lower inventory.
Fort Lauderdale remains the largest ocean access home segment in Northeast Broward, making it one of the most important indicators for the broader waterfront market. The mid-year data shows a seller-advantaged market, with 7.6 months of supply and a Market Index of 80. Sales activity increased 13.4% year over year, while median sale price rose 13.5% to $2,725,000. Price per square foot dipped slightly, which suggests some variation in the size and mix of homes sold, but the overall picture still points to stronger buyer demand and firm pricing at the higher end of the market.
Pompano Beach is also showing a stronger first half of the year. With 6.0 months of supply and a Market Index of 68, this segment remains in seller-advantage territory, but with a slightly more balanced feel than Fort Lauderdale or Lighthouse Point. Sales activity improved 15.9% year over year, while median sale price rose 16.9% and median price per square foot increased 15.7%. The longer-term trend still shows some pricing movement from year to year, but the current six-month data suggests renewed strength after a softer 2025.
Lighthouse Point is now included as its own ocean access report, and its first appearance in this summary is especially notable. With 5.5 months of supply and a Market Index of 80, Lighthouse Point currently has one of the strongest seller-advantage readings among the markets we track. Sales activity increased 37.8% year over year, although the data also shows why smaller waterfront markets require careful interpretation. Median sale price declined 5.0%, while median price per square foot increased 4.0%, suggesting that changes in the size and mix of homes sold had a meaningful impact on the headline price.
Non-waterfront single family homes east of US-1 are also an important part of the mid-year coastal market story. These homes are not on the water, but they remain highly desirable for buyers who want to live close to the beach, restaurants, parks, marinas and yacht clubs without paying direct waterfront pricing. With only 5.6 months of supply and a Market Index of 68, this segment is also showing a seller advantage. Median sale price rose 18.2% year over year and median price per square foot increased 13.4%, showing that demand for near-the-coast single family homes remains strong even without private dockage.
The most important mid-year takeaway is that demand has strengthened across both waterfront and near-the-coast single family markets. Ocean access homes are benefiting from renewed buyer activity and limited waterfront supply, while non-waterfront homes east of US-1 are also seeing stronger pricing as buyers continue to value coastal location.
The first half of 2026 suggests that the coastal single family market has moved beyond stabilization. Buyers are still selective, especially when it comes to condition, insurance costs, dockage, seawall condition and pricing, but stronger sales activity and firmer pricing suggest that well-positioned homes are still attracting serious demand.
Local Market Watch Reports – Dig Deeper
This article provides a high-level mid-year overview of Northeast Broward County’s single family home market near the coast. For a deeper dive into a specific area or property type, explore the full market reports below.
Northeast Broward County Single Family Ocean Access Homes
Start here for the broadest perspective. This report covers single family ocean access homes across Northeast Broward County, including Fort Lauderdale, Pompano Beach, Wilton Manors, Lauderdale-by-the-Sea, Lighthouse Point, and Deerfield Beach. The report provides valuable context for understanding how the region’s waterfront single family market is performing as a whole at mid-year.
Median Sale Price: $2,000,000 | Supply: 7.0 months | Waterfront Market Index: 74 (Seller Advantage)
Fort Lauderdale Single Family Ocean Access Homes
This report provides a closer look at Fort Lauderdale’s ocean access home market, one of the most active and influential waterfront single family segments in South Florida. The mid-year data shows stronger sales activity and higher median pricing, suggesting that buyer demand remains healthy despite more inventory than the unusually tight conditions seen during the pandemic boom.
Median Sale Price: $2,725,000 | Supply: 7.6 months | Waterfront Market Index: 80 (Seller Advantage)
Pompano Beach Single Family Ocean Access Homes
This report examines Pompano Beach’s single family ocean access market, where waterfront homes continue to attract buyers looking for boating access, coastal proximity, and relative value compared to some nearby waterfront markets. The first half of 2026 shows stronger sales activity and renewed pricing momentum, although longer-term pricing trends still suggest this segment is working toward a more consistent post-pandemic range.
Median Sale Price: $1,437,500 | Supply: 6.0 months | Waterfront Market Index: 68 (Seller Advantage)
Lighthouse Point Single Family Ocean Access Homes
This report focuses on Lighthouse Point’s single family ocean access market, one of Northeast Broward’s most established boating communities. The mid-year data shows a strong seller-advantage market, supported by tight inventory and a sharp increase in sales activity. Because Lighthouse Point is a smaller and more specialized market, changes in the size and mix of homes sold can have a noticeable impact on median price from one period to the next.
Median Sale Price: $2,650,000 | Supply: 5.5 months | Waterfront Market Index: 80 (Seller Advantage)
Northeast Broward County Single Family Non-Waterfront
This report focuses on single family non-waterfront homes east of US-1 in Northeast Broward County, including Fort Lauderdale, Lauderdale-by-the-Sea, Pompano Beach, Lighthouse Point and Deerfield Beach. These properties are not on the water, but they remain popular with buyers who want to live near the coast.
Price per square foot for these homes is about 27% lower than the broader ocean access segment, making this segment an important alternative for buyers who want the coastal lifestyle without direct waterfront pricing.
Median Sale Price: $1,300,000 | Supply: 5.6 months | Market Index: 68 (Seller Advantage)
Frequently Asked Questions
What is the Waterfront Market Index?
The Waterfront Market Index uses a proprietary methodology to give consumers a concise view of overall market conditions. Because every market segment is different, each area requires specialized analysis to understand its true balance between buyers and sellers. The index also considers recent buyer demand, days on market, and sale-to-list price ratios to provide a more complete picture than inventory alone.
A score near 50 generally indicates a balanced market, while higher scores favor sellers and lower scores favor buyers.
How is “Months of Supply” calculated?
Months of Supply estimates how long it would take for all current listings to sell if no new properties came on the market and sales continued at their current pace. It is calculated by dividing the number of active listings by the average monthly sales volume. Months of Supply is one of the most important factors in determining whether a particular market favors buyers or sellers, or if it is balanced.
What is a “Balanced” waterfront real estate market in South Florida?
While six months of supply is commonly considered a balanced market in other parts of the country, South Florida waterfront markets typically carry more inventory, partly because of the higher concentration of second homes and investment properties. These sellers are often less motivated than someone relocating or buying another primary residence, so they may keep a property on the market longer while waiting for an acceptable price. As a result, a single-family ocean-access market can remain balanced with as much as 10 months of supply.
Why does the mid-year update matter?
A mid-year update is useful because it looks at the first six months of the year together instead of reacting to one month of activity. This is especially important in waterfront and luxury markets, where individual sales can vary widely by price, size, location and property condition. Reviewing the first half of the year helps smooth out some of that volatility and provides a clearer view of the market’s direction.
How are ocean access homes different from non-waterfront homes?
Ocean access homes are influenced by many factors that do not apply to traditional non-waterfront homes. In addition to location, size, condition, and recent comparable sales, buyers also evaluate dockage, bridge clearance, water depth, canal width, seawall condition, boating access, insurance costs, elevation, and proximity to the inlet. These details can create meaningful differences in value, even between homes that appear similar at first glance.
Non-waterfront homes near the coast are different. They do not offer private dockage or direct water access, but they can still offer strong lifestyle value because of their proximity to beaches, restaurants, parks, marinas, yacht clubs, and coastal neighborhoods.
Can I own a boat without owning a waterfront home?
Yes. Many coastal homeowners keep their boats at local marinas, yacht clubs, or dry-storage facilities instead of owning a home with private dockage. For some buyers, this can be a more practical option because it may reduce maintenance responsibilities, insurance considerations, and the premium associated with direct waterfront ownership while still allowing them to enjoy the boating lifestyle.