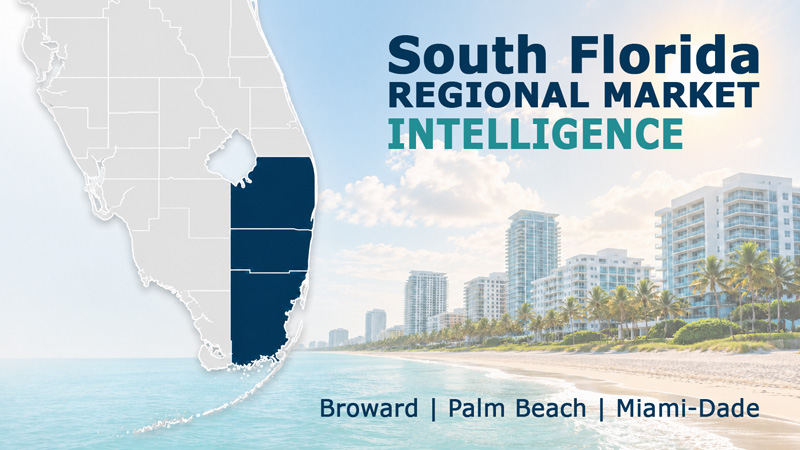
One of the most notable developments in South Florida’s housing market is the decline in available single-family inventory since spring 2025. Looking at the past two years provides important context for understanding how limited selection may be influencing sales activity. As the supply of available homes contracts, transaction volume can be influenced not only by buyer demand, but also by the availability of properties that meet buyers’ needs and expectations.
Single-Family Active Inventory: Two-Year Trend
Miami–Fort Lauderdale–West Palm Beach MSA | August 2024 – August 2026
Source: Florida Realtors® SunStats | Monthly Active Inventory
Key Statistic: 12,927 Active Listings
↓ 22% Year Over YearRegional Executive Summary
South Florida’s housing market entered the final stretch of summer with substantially less inventory than a year ago, but slightly fewer transactions. While declining sales can sometimes indicate softer buyer demand, the August data suggests a more nuanced market. With fewer properties available, buyers have less selection, and the remaining inventory may not always align with their expectations for pricing, condition or value.
The single-family market illustrates this relationship particularly well. Regional inventory declined 22% year over year, while closed sales decreased just 1.6%. Homes also reached contract faster, with median days on market falling from 48 to 40 days, and the median sale price increased 2.8% to $658,000. These figures are consistent with a market where limited selection may be constraining transaction volume, even as buyers continue to pursue desirable, appropriately priced properties.
The condominium market presents a different picture. Although regional inventory declined 13%, condos and townhouses still carried 9.7 months of supply. Closed sales decreased 5.1%, while the median sale price increased 4.4% to $329,000. With considerably more available inventory, pricing, building condition, association finances and overall ownership costs may play a greater role in determining which properties attract buyers.
At the county level, Palm Beach continued to have the tightest inventory conditions in both property categories. Broward experienced the largest decline in condominium sales, while Miami-Dade’s condo market recorded modest increases in both closed and pending sales despite carrying the region’s highest inventory supply. As South Florida moves toward the busier winter season, the relationship between available inventory, asking prices and buyer activity will be important to watch.
Fewer sales don’t necessarily mean fewer buyers. With single-family inventory down 22%, limited selection may be constraining transactions even as prices remain firm.
South Florida MSA
Lower Inventory May Be Constraining Sales Volume
| Metric | Single-Family Homes | Condos & Townhouses |
|---|---|---|
| Active Inventory | 12,927 (down 22%) | 26,692 (down 13%) |
| Median Days on Market | 40 days (down from 48) | 70 days (down from 71) |
| Months of Supply | 4.1 months (down from 5.7) | 9.7 months (down from 11.8) |
| Closed Sales | 2,986 (down 1.6%) | 2,559 (down 5.1%) |
| New Pending Sales | 3,285 (down 1.4%) | 2,893 (down 2.0%) |
| Median Sale Price | $658,000 (up 2.8%) | $329,000 (up 4.4%) |
South Florida’s single-family market remains relatively tight, with 4.1 months of supply and substantially fewer listings than a year ago. Despite a modest decline in closed sales, homes reached contract faster and median prices increased, suggesting that limited selection may be contributing to lower transaction volume. The condo market continues to offer considerably more choice, although its 9.7 months of supply represents an improvement from 11.8 months a year earlier.
Strategic takeaway: Lower transaction volume should not automatically be interpreted as weaker demand. In the single-family market, reduced inventory may be limiting sales opportunities, while condo buyers continue to have more selection and negotiating flexibility.
Broward County
Limited Single-Family Selection and a More Selective Condo Market
| Metric | Single-Family Homes | Condos & Townhouses |
|---|---|---|
| Active Inventory | 4,252 (down 23%) | 9,427 (down 15%) |
| Median Days on Market | 40 days (down from 47) | 73 days (down from 74) |
| Months of Supply | 4.1 months (down from 5.7) | 9.9 months (down from 11.9) |
| Closed Sales | 1,016 (up 0.1%) | 883 (down 9.3%) |
| New Pending Sales | 1,115 (down 5.4%) | 1,000 (down 8.3%) |
| Median Sale Price | $650,000 (up 4.0%) | $257,500 (up 4.0%) |
Broward’s single-family market maintained essentially unchanged sales volume despite a 23% reduction in available inventory. Homes also reached contract seven days faster than a year ago, while the median sale price increased 4.0%. The condo market experienced a more substantial decline in transactions, with closed sales down 9.3% and pending sales down 8.3%. Although inventory declined and prices increased, the nearly 10-month supply suggests that buyers remain selective about pricing, building condition and overall ownership costs.
Strategic takeaway: Broward’s single-family market continues to demonstrate resilience despite fewer available homes. Condo sellers face greater competition and should pay particular attention to pricing and building-specific factors that influence buyer decisions.
Palm Beach County
The Region’s Tightest Inventory Conditions
| Metric | Single-Family Homes | Condos & Townhouses |
|---|---|---|
| Active Inventory | 4,345 (down 24%) | 5,770 (down 17%) |
| Median Days on Market | 40 days (down from 46) | 69 days (down from 74) |
| Months of Supply | 3.5 months (down from 5.2) | 6.7 months (down from 9.0) |
| Closed Sales | 1,112 (down 2.0%) | 765 (down 6.7%) |
| New Pending Sales | 1,206 (up 1.6%) | 861 (down 0.8%) |
| Median Sale Price | $650,000 (up 3.2%) | $300,000 (up 5.3%) |
Palm Beach continued to have the lowest months of supply among the three counties, with just 3.5 months for single-family homes and 6.7 months for condos and townhouses. Although closed sales declined in both categories, inventory also contracted substantially, marketing times shortened and median prices increased. Single-family pending sales rose 1.6%, suggesting that buyer activity remains relatively steady despite limited available selection. The condominium market also recorded the region’s strongest year-over-year median price increase at 5.3%.
Strategic takeaway: Palm Beach’s comparatively limited inventory continues to support pricing in both property categories. The modest decline in closed sales should be considered alongside reduced selection, faster marketing times and relatively stable pending activity.
Miami-Dade County
Single-Family Supply Tightens While Condo Buyers Retain More Choice
| Metric | Single-Family Homes | Condos & Townhouses |
|---|---|---|
| Active Inventory | 4,330 (down 19%) | 11,495 (down 9.0%) |
| Median Days on Market | 40 days (down from 51) | 66 days (down from 67) |
| Months of Supply | 4.9 months (down from 6.4) | 12.1 months (down from 14.0) |
| Closed Sales | 858 (down 3.1%) | 911 (up 0.9%) |
| New Pending Sales | 964 (down 0.2%) | 1,032 (up 4.0%) |
| Median Sale Price | $680,000 (up 3.8%) | $408,000 (down 0.5%) |
Miami-Dade’s single-family inventory declined 19%, while closed sales decreased a more modest 3.1%. Homes reached contract considerably faster than a year ago, and the median sale price increased 3.8%, indicating that reduced transaction volume has not been accompanied by broad deterioration in these measures. The condominium market presents a different dynamic, with 12.1 months of supply and a slight decline in median price. However, closed sales increased 0.9% and pending sales rose 4.0%, suggesting that buyers are continuing to transact within this more inventory-rich market.
Strategic takeaway: Miami-Dade’s single-family market remains relatively firm despite fewer transactions, while condo buyers have the region’s greatest selection. Modest improvements in condo sales and pending activity suggest that opportunities are attracting interest when pricing and property characteristics align with buyer expectations.
What the Market Means for You
For Buyers
Lower single-family inventory means buyers may have fewer suitable properties to choose from, even when overall sales activity slows. Well-maintained, appropriately priced homes can still attract interest, so buyers should be prepared when the right opportunity becomes available. Condo buyers generally have more selection and negotiating flexibility, but should evaluate association finances, reserves, insurance, assessments and building condition alongside the purchase price.
For Sellers
Reduced inventory can create opportunities for sellers, but it does not guarantee a successful sale at any asking price. Buyers are comparing available properties carefully and may pass over listings that do not offer sufficient value. Accurate pricing, strong presentation and attention to property condition remain essential. Condo sellers should also be prepared to address building-related concerns and demonstrate the property’s overall ownership value.
Key Takeaways
- Inventory is the defining regional trend: Single-family inventory declined 22% year over year, while closed sales decreased just 1.6%. Limited selection may be contributing to lower transaction volume.
- Single-family homes are reaching contract faster: Regional median days on market declined from 48 to 40 days, while the median sale price increased 2.8%.
- Condo buyers retain more flexibility: With 9.7 months of regional supply, condos and townhouses continue to offer considerably more selection than single-family homes.
- Palm Beach has the tightest supply: Months of supply measured 3.5 for single-family homes and 6.7 for condos and townhouses.
- Pricing and property quality remain critical: Available inventory does not necessarily translate into suitable buying opportunities when asking prices, property condition or ownership costs do not meet buyer expectations.
Regional Outlook
South Florida enters the fall season with substantially less inventory than a year ago, particularly in the single-family market. The combination of reduced supply, shorter marketing times and continued price growth suggests that lower sales volume may be influenced by limited selection rather than a broad withdrawal of buyers. However, inventory and transaction statistics alone cannot establish how much of the change reflects buyer demand, affordability, pricing or the availability of suitable properties.
The coming months will help clarify this relationship. New pending sales, changes in active inventory and pricing trends will provide important insight into whether buyers are finding properties that meet their needs and expectations. For sellers, the central challenge remains positioning their properties competitively; for buyers, the opportunity lies in identifying properties that offer the right combination of price, condition and long-term value.
About the Data
This report is based on August 2026 Florida Realtors® SunStats data for the Miami–Fort Lauderdale–West Palm Beach MSA and Broward, Palm Beach and Miami-Dade counties. Florida Realtors categorizes attached properties as Townhouses and Condos. The report displays Florida Realtors’ Median Time to Contract statistic under the heading Median Days on Market.
The percentages and prior-year figures shown are year-over-year comparisons. The featured inventory chart displays 25 monthly observations from August 2024 through August 2026. Median sale prices reflect the mix of properties sold during each reporting period and do not necessarily represent changes in the value of individual properties.
Regional and county statistics provide broad market context and should not be interpreted as a valuation of a particular property, condominium building or neighborhood. Additional measures, including new listings, price reductions and sale-to-list-price ratios, can help provide further insight into the relationship between available inventory, asking prices and buyer demand.