Northeast Broward County Summary
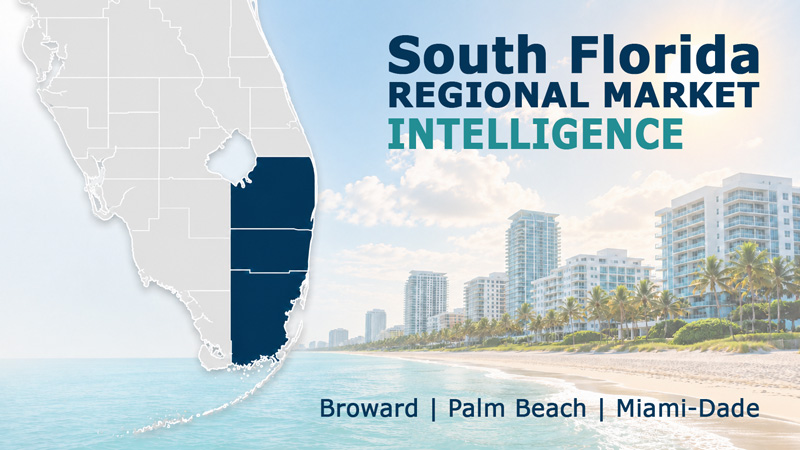
Fort Lauderdale, Lauderdale-by-the-Sea, Pompano Beach, Lighthouse Point, Deerfield Beach and Wilton Manors
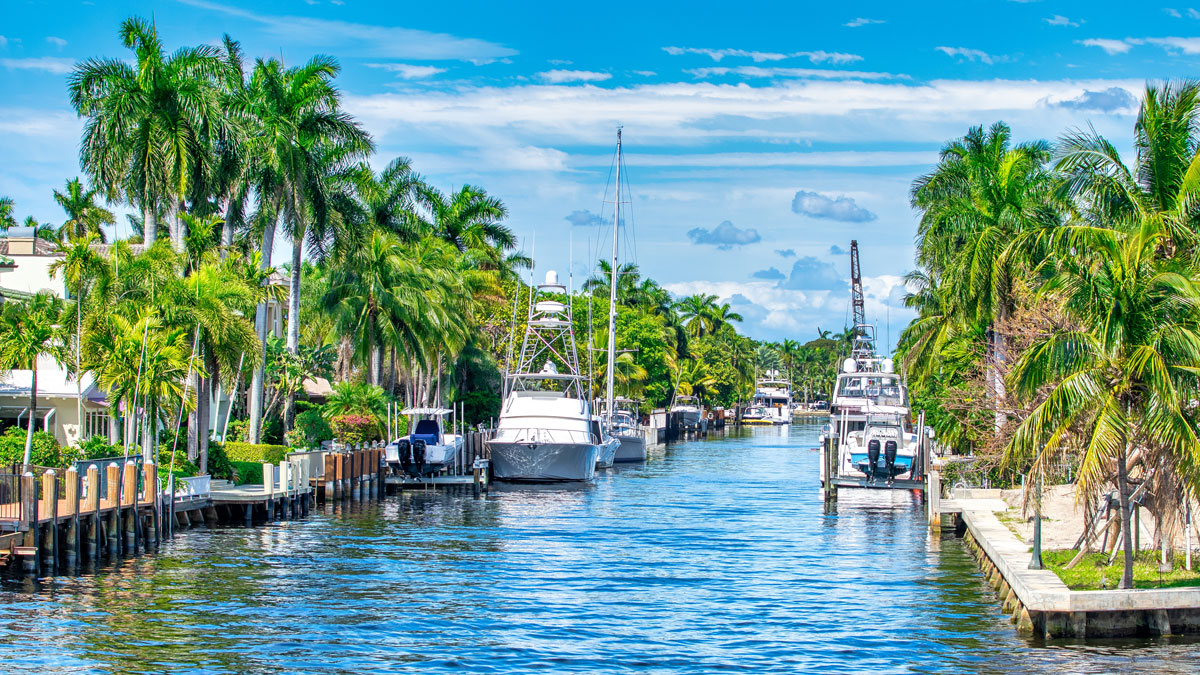
September’s Local Market Watch reports reveal an interesting development in our single family ocean access market. Sales activity continues to strengthen, with double-digit increases across every waterfront segment we track. At the same time, inventory has increased in several markets, giving buyers additional choices without significantly weakening the advantage currently held by sellers.

The combination of rising sales volume and increasing inventory suggests a market that is becoming more active on both sides of the transaction. Buyers are returning to the market in greater numbers, while additional listings are providing more opportunities to find the right waterfront property. For sellers, competitive pricing and property condition remain important, but the increase in sales activity over the latest six-month period demonstrates continued buyer demand for ocean access homes.
Across Northeast Broward County, the broader Single Family Ocean Access market remains firmly in seller-advantage territory, with 370 active listings, 6.9 months of supply and a Waterfront Market Index of 76. Closed sales increased 25.6% year over year to 358 homes during the April through September period. Median sale price rose 20.1% to $2,125,000, while price per square foot increased 14.2% to $842. The improvement in both pricing measures is particularly notable because the median size of homes sold remained virtually unchanged, suggesting that the increase was not simply the result of larger homes changing hands.
Fort Lauderdale continues to lead the region in both market activity and pricing strength. The latest six-month period produced 189 closed sales, an increase of 32.2% over the same period last year. Median sale price climbed 31.7% to $2,700,000, while price per square foot increased 11.2% to $892. Homes also sold considerably faster, with median days on market declining from 71 to 54. Although inventory has increased to 225 active listings and months of supply has risen to 7.9, the Market Index of 81 continues to indicate a strong seller’s market. The larger median size of homes sold contributed to the increase in median price, but the substantial gain in price per square foot confirms broader pricing improvement as well.
Pompano Beach is also showing strong sales momentum and pricing growth. Closed sales increased 28.4% year over year, while median sale price rose 9.8% to $1,400,000 and price per square foot increased 12.3% to $757. With 65 active listings, 4.9 months of supply and a Market Index of 76, Pompano Beach has the lowest months of supply among the ocean access markets covered in this report. Days on market increased slightly from 61 to 63, but the sale-to-list price ratio improved from 94% to 95%, suggesting that sellers are achieving somewhat stronger results in negotiations.
Lighthouse Point presents a more nuanced picture. Sales activity increased 17.8% year over year, with 53 homes sold during the latest six-month period, and median price per square foot rose 5.3% to $860. However, median sale price declined 3.2% to $2,700,000, while the median size of homes sold decreased 12.0%. This difference suggests that the smaller size of homes changing hands contributed to the lower median sale price. Market conditions still favor sellers, with 6.9 months of supply and a Market Index of 78, although the increase in days on market from 57 to 85 indicates that homes are taking longer to sell despite stronger overall sales volume.
Non-waterfront single family homes east of US-1 are also demonstrating considerable market strength. These homes appeal to buyers seeking proximity to the beach, restaurants, parks and boating facilities without the higher acquisition and maintenance costs associated with direct waterfront ownership. Closed sales increased 25.8% year over year, while median days on market declined sharply from 73 to 46. Median sale price increased a modest 0.9% to $1,150,000, and price per square foot rose 3.2% to $578. With 5.5 months of supply and a Market Index of 75, this segment remains firmly in seller-advantage territory.
Sales volume is up across all five coastal single family markets compared to last year. Although buyers have more waterfront homes to choose from in several areas, stronger sales activity and steady demand are helping sellers maintain their advantage. Price per square foot has also increased in every segment, reflecting continued strength in the coastal housing market.
Looking ahead, the relationship between inventory growth and sales activity will be an important trend to monitor. The latest reports show that buyers are absorbing more homes than they were a year ago, but rising inventory could provide additional negotiating opportunities if the pace of new listings begins to outstrip demand. For now, the September data points to an active coastal single family market with meaningful differences in pricing, market pace and negotiating conditions from one community to another.
Local Market Watch Reports – Dig Deeper
For a deeper dive into a specific area or property type, explore the full market reports below.
Northeast Broward County Single Family Ocean Access Homes
Start here for the broadest perspective. This report covers single family ocean access homes across Northeast Broward County, including Fort Lauderdale, Pompano Beach, Wilton Manors, Lauderdale-by-the-Sea, Lighthouse Point and Deerfield Beach. The September data shows substantial improvement in sales activity and pricing, with the median sale price increasing 20.1% and price per square foot rising 14.2% year over year.
Median Sale Price: $2,125,000 | Supply: 6.9 months | Waterfront Market Index: 76 (Seller Advantage)
Fort Lauderdale Single Family Ocean Access Homes
Fort Lauderdale continues to be one of South Florida’s most active and diverse ocean access home markets. The latest report shows a significant increase in sales volume, higher median prices and a faster sales pace. Despite an increase in available inventory, the Market Index continues to indicate a strong seller’s market.
Median Sale Price: $2,700,000 | Supply: 7.9 months | Waterfront Market Index: 81 (Strong Seller’s Market)
Pompano Beach Single Family Ocean Access Homes
Pompano Beach offers a diverse selection of ocean access homes, with boating opportunities that include convenient access to the Intracoastal Waterway and Hillsboro Inlet. September’s report shows a 28.4% increase in sales activity and continued improvement in pricing, with months of supply remaining below the other ocean access markets covered in this summary.
Median Sale Price: $1,400,000 | Supply: 4.9 months | Waterfront Market Index: 76 (Seller Advantage)
Lighthouse Point Single Family Ocean Access Homes
Lighthouse Point remains a specialized market for waterfront homes with ocean access. Sales activity and price per square foot increased year over year, although median sale price declined as the median size of homes sold decreased. Because this is a smaller market, changes in the mix of properties sold can significantly affect headline pricing statistics. The Market Index continues to indicate a seller advantage.
Median Sale Price: $2,700,000 | Supply: 6.9 months | Waterfront Market Index: 78 (Seller Advantage)
Northeast Broward County Single Family Non-Waterfront
This report focuses on single family non-waterfront homes east of US-1 in Northeast Broward County, including Fort Lauderdale, Lauderdale-by-the-Sea, Pompano Beach, Lighthouse Point and Deerfield Beach. These properties remain popular with buyers who want to live near the coast without paying direct waterfront prices.
At $578 per square foot, the segment’s median price per square foot is approximately 31% lower than the broader ocean access market at $842 per square foot. This comparison highlights an important pricing distinction between the two segments, although individual property values also depend on location, condition, size and other characteristics.
Median Sale Price: $1,150,000 | Supply: 5.5 months | Market Index: 75 (Seller Advantage)
Frequently Asked Questions
What is the Waterfront Market Index?
The Waterfront Market Index uses a proprietary methodology to give consumers a concise view of overall market conditions. Because every market segment is different, each area requires specialized analysis to understand its true balance between buyers and sellers. The index considers inventory, recent buyer demand, days on market and sale-to-list price ratios to provide a more complete picture than inventory alone.
A score near 50 generally indicates a balanced market, while higher scores favor sellers and lower scores favor buyers.
How is “Months of Supply” calculated?
Months of Supply estimates how long it would take for all current listings to sell if no new properties came on the market and sales continued at their current pace. It is calculated by dividing the number of active listings by the average monthly sales volume over the trailing 12 months.
Important note: The benchmark for a balanced market varies by property type and location. Waterfront markets typically carry more inventory and have longer selling periods than traditional residential markets, so Months of Supply should be interpreted in the context of each market.
Why can median sale price and price per square foot move in different directions?
Median sale price is influenced by the size and type of homes sold during a particular period. When smaller homes account for a greater share of sales, the median sale price can decline even if values per square foot are increasing. This is particularly important in smaller waterfront markets, where relatively few transactions can influence the overall statistics.
How are ocean access homes different from non-waterfront homes?
Ocean access homes are influenced by many factors that do not apply to traditional non-waterfront homes. In addition to location, size, condition and recent comparable sales, buyers also evaluate dockage, bridge clearance, water depth, canal width, seawall condition, boating access, insurance costs, elevation and proximity to the inlet. These details can create meaningful differences in value, even between homes that appear similar at first glance.
Non-waterfront homes near the coast do not offer private dockage or direct water access, but they can still offer strong lifestyle value because of their proximity to beaches, restaurants, parks, marinas, yacht clubs and coastal neighborhoods.
Can I own a boat without owning a waterfront home?
Yes. Many coastal homeowners keep their boats at local marinas, yacht clubs or dry-storage facilities instead of owning a home with private dockage. For some buyers, this can be a practical alternative because it may reduce maintenance responsibilities and the premium associated with direct waterfront ownership while still allowing them to enjoy the boating lifestyle.