Northeast Broward County Summary
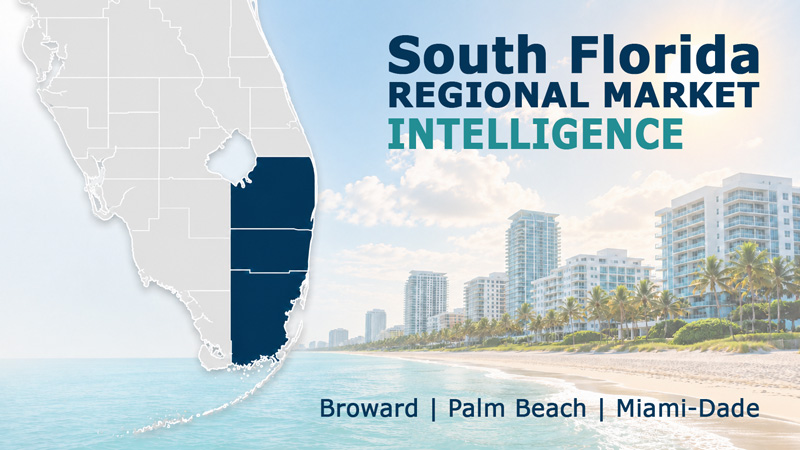
Fort Lauderdale, Lauderdale-by-the-Sea, Pompano Beach, Hillsboro Beach and Deerfield Beach
September’s Local Market Watch reports show continued improvement in sales activity across much of the Northeast Broward waterfront condo market. Closed sales increased year over year in five of the six market segments we track, including particularly strong gains in Fort Lauderdale Beach and Pompano Beach. Pricing trends were more mixed, however, reinforcing the importance of looking beyond the broader market and evaluating individual locations and buildings.

The latest reports continue to show a condo market that is becoming more active, but not uniformly stronger across every segment. Buyers remain selective about building condition, reserve funding, insurance costs, special assessments and overall value, while stronger sales volume is helping absorb available inventory in several markets. For sellers, current conditions continue to reward realistic pricing and properties that compare favorably within their individual buildings.
Across Northeast Broward County, the broader oceanfront condo market remains slightly in seller-advantage territory, with 558 active listings, 9.4 months of supply and a Waterfront Market Index of 62. Closed sales increased 19.2% year over year to 391 units during the April through September period. Median sale price increased 1.7% to $699,000, while price per square foot rose 5.3% to $498.
Market velocity also remained relatively steady, with median days on market improving slightly from 75 to 74 days and the sale-to-list price ratio increasing from 94% to 95%. Inventory increased modestly from the prior month, pushing months of supply somewhat higher, but the combination of stronger sales activity and firmer pricing continues to support the seller-advantage Market Index reading.
Fort Lauderdale Beach recorded the largest increase in sales activity among the oceanfront markets we track. Closed sales increased 60.0% year over year, from 45 to 72 units during the latest six-month period. Median sale price was essentially unchanged at $1,447,750, down just 0.5%, while median price per square foot increased 6.9% to $834.
The difference between those two pricing measures is important. The median size of condos sold declined 10.4%, from 1,905 to 1,707 square feet, helping explain why the overall median price remained flat even as buyers paid more per square foot. With 139 active listings, 14.4 months of supply and a Market Index of 64, Fort Lauderdale Beach remains in seller-advantage territory despite its relatively high inventory level.
Galt Ocean Mile presents a more mixed picture. Closed sales increased 11.6% year over year to 106 units, while median days on market improved substantially from 94 to 67 days and the sale-to-list price ratio increased from 92% to 94%. Pricing moved in the opposite direction, with median sale price declining 13.0% to $570,000 and median price per square foot falling 7.5% to $417.
With 129 active listings, 7.9 months of supply and a Waterfront Market Index of 63, Galt Ocean Mile remains in seller-advantage territory. The combination of stronger sales activity and shorter marketing times alongside lower pricing illustrates why overall market conditions cannot be measured by price movement alone.
Lauderdale-by-the-Sea remains a balanced market, with 78 active listings, 9.2 months of supply and a Waterfront Market Index of 57. Closed sales declined 7.5% year over year to 62 units, while median sale price fell 20.5% to $525,000 and median price per square foot declined 10.2% to $438. Median days on market increased modestly from 57 to 62 days, while sellers continued to achieve 95% of list price.
Because Lauderdale-by-the-Sea is a smaller oceanfront condo market, relatively small changes in the number and type of units sold can have a greater effect on short-term statistics. Even with that consideration, the latest six-month data shows softer pricing and sales activity compared with the same period last year.
Pompano Beach continues to post some of the strongest results in the region. Closed sales increased 36.8% year over year to 104 units, while median sale price climbed 34.1% to $764,200 and median price per square foot rose 12.3% to $502. With 134 active listings, 8.1 months of supply and a Waterfront Market Index of 64, the market remains in seller-advantage territory.
The median size of condos sold increased 17.6%, which contributed to the substantial increase in median sale price. However, the simultaneous 12.3% increase in price per square foot confirms that the pricing improvement was not simply the result of larger units changing hands. The sale-to-list price ratio also improved from 94% to 96%, even as median days on market increased from 66 to 72.
Fort Lauderdale condos with boat slips remain in balanced market territory, with 277 active listings, 10.9 months of supply and a Waterfront Market Index of 49. Closed sales increased 6.4% year over year to 166 units, while median sale price rose 14.6% to $450,000. Median price per square foot was essentially unchanged, declining just 0.6% to $358, while median days on market held steady at 71 days.
It’s hard to pinpoint exactly why the median sale price increased, but this specialized waterfront segment does include a wide variety of condominium types, dockage arrangements and price points, all of which can have a meaningful impact on median pricing from one period to the next.
Sales activity is stronger than a year ago across most of the waterfront condo markets we track. Overall conditions have improved, but pricing remains uneven from one segment to another. The broader takeaway is a more active market with buyers still highly selective about value, building condition and ownership costs.
Looking ahead, the relationship between sales activity, inventory and pricing will remain important to watch. Buyer demand has improved across much of the waterfront condo market, but differences in pricing and building-specific factors continue to shape performance from one segment to another.
Local Market Watch Reports – Dig Deeper
For a deeper dive into a specific area or property type, explore the full market reports below.
Northeast Broward County Oceanfront Condos
Start here for the broadest perspective. This report covers oceanfront condos in Fort Lauderdale, Lauderdale-by-the-Sea, Pompano Beach, Hillsboro Beach and Deerfield Beach. September’s data shows a 19.2% increase in sales activity, while median sale price increased 1.7% and price per square foot rose 5.3% year over year.
Median Sale Price: $699,000 | Supply: 9.4 months | Waterfront Market Index: 62 (Seller Advantage)
Fort Lauderdale Beach Oceanfront Condos
Fort Lauderdale Beach recorded a significant increase in sales activity, with closed sales rising 60.0% compared with the same six-month period last year. Median sale price remained essentially unchanged, while price per square foot increased 6.9%. The smaller median size of units sold helps explain the difference between those two pricing measures.
Median Sale Price: $1,447,750 | Supply: 14.4 months | Waterfront Market Index: 64 (Seller Advantage)
Galt Ocean Mile Oceanfront Condos
Galt Ocean Mile remains one of Fort Lauderdale’s largest and most established oceanfront condo markets. September’s report shows higher sales volume, substantially shorter marketing times and an improved sale-to-list price ratio, although both median sale price and price per square foot declined compared with the same period last year.
Median Sale Price: $570,000 | Supply: 7.9 months | Waterfront Market Index: 63 (Seller Advantage)
Lauderdale-by-the-Sea Oceanfront Condos
This report focuses on oceanfront condos located directly on the sand in Lauderdale-by-the-Sea. Sales activity and pricing declined compared with the same six-month period last year, while the Market Index continues to indicate balanced conditions. Because this is a smaller market, changes in the mix of units sold can have a greater impact on short-term statistics.
Median Sale Price: $525,000 | Supply: 9.2 months | Waterfront Market Index: 57 (Balanced)
Pompano Beach Oceanfront Condos
Pompano Beach continues to show strong sales and pricing momentum. Closed sales increased 36.8% year over year, while median sale price rose 34.1% and price per square foot increased 12.3%. Although larger units accounted for some of the increase in median pricing, the gain in price per square foot confirms broader pricing strength.
Median Sale Price: $764,200 | Supply: 8.1 months | Waterfront Market Index: 64 (Seller Advantage)
Fort Lauderdale Condos with Boat Slips
This report focuses on Fort Lauderdale condominiums with ocean access and boat slips or marina facilities. Sales activity increased 6.4% year over year and median sale price rose 14.6%, while price per square foot remained essentially unchanged. With a Market Index of 49, this specialized segment remains balanced.
Median Sale Price: $450,000 | Supply: 10.9 months | Waterfront Market Index: 49 (Balanced)
Frequently Asked Questions
What is the Waterfront Market Index?
The Waterfront Market Index uses a proprietary methodology to give consumers a concise view of overall market conditions. Because every market segment is different, each area requires specialized analysis to understand its true balance between buyers and sellers. The index considers inventory, recent buyer demand, days on market and sale-to-list price ratios to provide a more complete picture than inventory alone.
A score near 50 generally indicates a balanced market, while higher scores favor sellers and lower scores favor buyers.
How is “Months of Supply” calculated?
Months of Supply estimates how long it would take for all current listings to sell if no new properties came on the market and sales continued at their current pace. It is calculated by dividing the number of active listings by the average monthly sales volume over the trailing 12 months.
Important note: The benchmark for a balanced market varies by property type and location. Waterfront markets typically carry more inventory and have longer selling periods than traditional residential markets, so Months of Supply should be interpreted in the context of each market.
Why can median sale price and price per square foot move in different directions?
Median sale price is influenced by the size, type and price range of condos sold during a particular period. If larger or more expensive units account for a greater share of sales, median sale price can rise even when price per square foot is relatively unchanged. Conversely, smaller units can produce a lower median sale price even when buyers are paying more per square foot. This is especially important in smaller condo markets, where changes in the mix of units sold can significantly influence headline statistics.
Why can two nearby waterfront condo buildings perform differently?
Waterfront condo values depend on much more than location and square footage. Buyers also evaluate building age and condition, reserve funding, insurance costs, special assessments, completed inspections, amenities, parking, marina access, rental restrictions, views and the condition of the individual unit. These differences can create meaningful variations in demand and pricing, even between neighboring buildings with similar waterfront locations.
How do reserves, inspections and special assessments affect condo values?
Reserve funding, structural inspections and special assessments can have a significant impact on both buyer demand and financing. A building with well-funded reserves and clearly documented maintenance needs may be easier for buyers to evaluate, while large pending assessments or uncertainty about future repairs can affect affordability and negotiating decisions. These factors should be reviewed alongside the unit itself when comparing condominium values.
What should buyers review before purchasing a waterfront condo?
Buyers should carefully review the condominium budget, financial statements, reserve information, milestone inspection reports, Structural Integrity Reserve Study (SIRS), insurance coverage, meeting minutes, pending or approved special assessments and building rules. For condos with boat slips, buyers should also confirm slip ownership or assignment, vessel restrictions, water depth, bridge clearance, marina fees and access to the Intracoastal Waterway or ocean.